Over the past 20 years, the U.S. Navy has widely implemented the use of advanced ultra-high-solids (UHS) coatings for the protection of ship tanks and voids to extend the life of tank coatings.1,2,3 The Navy intends these coatings to provide 20 years of service. Experience to date has been largely positive concerning these coatings, although they are not immune to breakdown prior to the end of their intended service lives. In areas of breakdown, the maintenance community needs a suitable touch-up and repair coating and as part of this ongoing effort, the Navy sought methods to improve basic coating test methods to better assess repair coating performance. The program intended to conduct testing that would determine greater than 10 years of service life.
As seen in the April 2018 Edition of the Journal of Protective Coatings and Linings (JPCL) and on Paintsquare.com
The technical community identified repair coatings applied to hull cuts and stringers as particularly problematic. Particular challenges include application of coatings over inadequate surface profile adjacent to weld-beads and the effectiveness of hand-tool cleaning in promoting long coating life in a repair scenario (Fig. 1). The Navy implemented an expansive study of coatings applied over pre-rusted and hand-tool-cleaned steel intending to rate the performance of coatings using traditional visual inspection methods. The objective of this article is to report on observations of corrosion and material loss under coatings included in this test and suggest the criticality of making such observations in the ranking of coating effectiveness to augment traditional visual ranking methods.
 Fig. 1: Initial coating deterioration at weld beads and edges. Figures courtesy of the authors
EXPERIMENTAL PROCEDURE
To evaluate repair coatings applied directly to corroded, uneven steel such as a tank access cut, the program included flat plate panels with a weld bead on each. The base plate consisted of a nominal 4-inch-by-6-inch-by-1/8-inch-thick carbon steel panel. A 1/4-inch-high and 1/4-inch-wide weld bead was placed roughly 1 inch in from the panel’s long-edge, extending 4 inches along the center length of the panel.
After the weld bead was applied, the panels were abrasive blasted to an SSPC-SP 5/NACE No. 1, “White Metal Blast Cleaning” finish creating a 2-to-3-mil surface profile.4 Twenty-seven panels were prepared. The backs and edges of the panels were coated with a high-solids epoxy per the manufacturer’s instructions, leaving only the front face with the weld bead exposed. The panels were subjected to 30 days of alternate natural seawater immersion (12 hours wet/dry) in Key West, Florida to artificially age or “pre-rust” the steel.
Upon removal, the weld bead panel front face was cleaned to SSPC-SP 11, “Bare Metal Power Tool Cleaning” using a needle gun.5 Surface profile and conductivity were measured and recorded for each panel. For a set of nine panels, one of three specific repair coatings was applied by brush and roller to achieve specific dry-film-thickness (DFT) target levels of 5, 10 and 15 mils. Table 1 summarizes the coating test matrix.
Table 1: Coating Test Matrix for Test Panels.

The three repair coatings applied were a rapid curing, edge-retentive epoxy (98-percent solids), a surface-tolerant epoxy (90-percent solids) and a polyamide epoxy (67-percent solids). Manufacturers’ recommendations were followed for all environmental conditions and curing time. Coating thickness, surface profile and surface conductivity QA data were obtained using standard Navy practices as documented in NAVSEA Standard Item 009-32.6 Five DFT measurements were taken on the face of each coated panel. A single profile and surface contamination reading was taken on the face of each panel.
After curing of the coating and prior to immersion testing, the panel had an intentional scribe made in the coating. This was a 1/8-inch-wide scribe made with a 1/8-inch-wide spiral mill bit using a milling machine. This scribe in the coating was placed parallel to the weld bead, 1 inch from the opposite edge of the coated panel.
The panels were exposed in natural seawater alternate immersion (12 hours wet/dry) in Key West, Florida and were periodically inspected for coating blistering and rust-through on the faces of the panels using the procedures of ASTM D714 and ASTM D610 respectively.7,8 Cutback at the scribe was measured by ASTM D 16549. Cutback data were reported as actual measurements in mils (0.001 inch), not the standard rating scale. A single panel from each set of three from Table 1 was destructively inspected after 12 months of exposure. The remaining two of three panels from each set were destructively inspected after 40 months of exposure.
At the conclusion of the exposure, all panels were soaked in a methylene chloride paint stripper and subsequently glass-bead blasted with 80-to-120 grit glass at 80 psi to remove all coating and corrosion products without altering or removing the underlying steel.
To evaluate material loss of the steel substrate under and adjacent to the scribe, the depths of corrosion attack (pits) were measured to the nearest 0.001 inch using a needle micrometer. Pits were identified and categorized as either adjacent to/contiguous with corrosion activity around the intentional scribe or on the general panel surface away from the scribe/around the weld bead. The pitting corrosion depth data that follows is presented as being either on the “panel face” or “adjacent to the scribe.” Note that the pitting measured adjacent to the scribe and on the panel face was found only after removing visually intact coating. A minimum of the three deepest pits were recorded in each area on each panel.
RESULTS
Visual Data
The weld bead panel preparation at the target thicknesses of 5, 10 and 15 mils resulted in panels with average DFTs of 5.7, 10.2 and 15.7 mils with a coefficient of variation of less than 7 percent. The target thicknesses were carefully controlled and met. Before application of the repair materials, the surface profile was between 2.2 and 3.0 mils, essentially retaining much of the original blast profile simply with the removal of visible corrosion products (leaving rust staining as permitted in SSPC SP-11),5 although the profile did become more visibly rounded from the needle gun. The surface salt readings before application of the repair material ranged from 140-to-218 µS/cm, with an average of 185 µS/cm.
Over the course of the exposure period, coating rust-through and blistering was observed, inspected for and recorded for each test panel. Figure 2 shows the typical progression of deterioration observed visually on System 1 at a 5 mil thickness.
Over time, there is obvious corrosion developing at the scribe, leading to coating undercutting. There is also the onset of deterioration at the weld bead and on the general panel surface. Figure 3 provides the summary of the visual inspection data via ASTM D714 and D610 for all three coating systems at the three different film thicknesses over the exposure period.8,9
Figure 4 provides a summary of the cutback data for these same systems and thicknesses over the exposure period.
 Fig. 2: System 1 at three (top, left), six (top, right), 12 (bottom, left) and 40 months (bottom, right) of exposure.
 Fig. 3: Summary of blistering and rust-through data via visual inspection: System 1 (top), System 2 (center) and System 3 (bottom).
 Fig. 4 (left): Summary of cutback measurements via destructive inspection: System 1 (top), System 2 (center) and System 3 (bottom).
These standard inspection and evaluation criterion data suggest the following conclusions concerning the performance of each coating.
For coatings with blistering, those with a lower film build tended to blister first and to the greatest extent. Over time, selected blisters would break and become active rusting sites. Blisters tended to form initially adjacent to scribes; over time, more blisters were observed remote from the scribes.
Coating cutback increased over time. There did not appear to be a strong correlation with film thickness for the range of coatings and thicknesses tested.
The coating with the least visually apparent damage is the polyamide epoxy system, System 3. This coating system had substantially less blistering and rusting than any of the other coatings.
Material Loss/Corrosion Data
Table 2 summarizes data on the raw depth of attack after coating removal and measurement of the deepest pits. These data are from defects in the repair coatings. No significant pits were noted in the obverse side of the test panel protected with a high-solids coating applied over the original abrasive-blasted surface preparation.
Figure 5 shows the physical appearance of corrosion attack under a 15-mil-thick polyamide epoxy coating after 40 months of exposure.
Both Figures 5 and 6 show the presence of pitting corrosion under the previously intact coating systems. The deepest pits were observed adjacent to the scribe, though still not visible before coating removal. Figure 7 shows the distribution of the extent of pitting corrosion around the scribe over time. These data, and the subsequent similar plots, are presented as normal distributions of the data. This distribution was selected as a convenience, as some of the data do not fit well to a normal distribution.
From month 12 to month 40, the mean pit depth doubles from 6 to 13 mils. The deepest pits approach 30 mils after 40 months of alternate immersion exposure, suggesting a corrosion rate of 9 mils per year under the coating. Figure 8 shows the 40-month pit data adjacent to the scribe as a function of coating type.
Table 2: Summary of Depth of Attack Data (in inches).

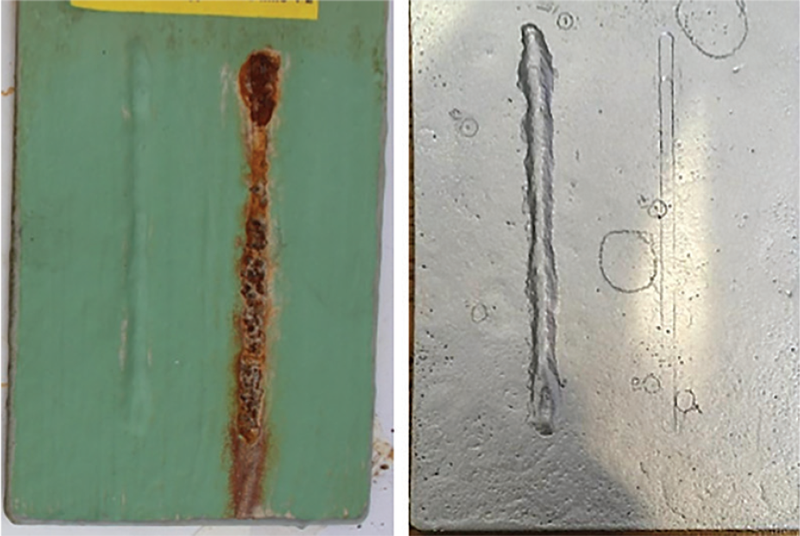 Fig. 5: System 3 polyamide epoxy 15-mil-thick coating at the end of exposure (left) and after coating removal at 40 months alternate seawater immersion (right).
 Fig. 6: System 1 edge-retentive epoxy 15-mil-thick coating at the end of exposure (left) and after coating removal after 40 months of alternate seawater immersion (right).
The surface-tolerant coating, System 2, performs quite differently than the polyamide epoxy System 3, and does so consistently. These data show a real difference in barrier coating performance when compared to the visual inspection data in Figures 4 and 5.
 Fig. 7: Pitting corrosion depth adjacent to the scribe over time at 12 and 40 months of exposure.
 Fig. 8: Pitting corrosion depth adjacent to the scribe by coating type at 40 months of exposure, System 1 (green), System 2 (blue) and System 3 (red).
 Fig. 9: Pitting corrosion depth adjacent to the scribe as a function of blister density, 40 months of exposure.
Figure 9 shows the pit depths adjacent to the scribe for all coatings as a function of the ASTM D714 blister density rating.9 The panels exhibited visual ratings of dense, medium and few (D, M and F) blistering. The code “N” indicates none or no blistering.
Figure 9 also suggests that pitting corrosion is associated with blistering, although the deepest pits are on those panels with few blisters as opposed to medium or dense blistering. This increase may be associated with the blisters serving as anodic sites to other areas of the panel. A limited number of blisters would tend to concentrate the anodic current.
Figure 10 shows the distribution of pits found outside of the scribe on the face of the panel as a function of exposure time.
The figure exhibits at least two distributions: those panels without any sensible pitting and those with pitting. For the panels with pitting on the face, the depth approaches the depth of those at the scribe but appears to be of a slightly lower magnitude.
 Fig. 10: Pitting corrosion depth on the panel face over time, at 12 and 40 months of exposure.
 Fig. 11: Pitting corrosion depth on the panel face by coating type at 40 months of exposure, System 1 (green), System 2 (blue) and System 3 (red).
 Fig. 12: Pitting corrosion depth on the panel face as a function of blister density at 40 months of exposure.
 Fig. 13: Maximum pit depth adjacent to the scribe vs. measured coating cutback at the scribe.
 Fig. 14: Pit depth on panel face vs. pit depth adjacent to the scribe.
Figure 11 shows the panel face pit data as a function of coating type. In this condition, there is not a consistent impact of coating type.
Figure 12 shows the impact of the blister density rating on panel pit depths outside the scribe area on the face of the panel.
Figure 13 shows the relationship between the pit depth adjacent to the scribe and the maximum measured cutback (undercutting) of the coating adjacent to the scribe. There is no apparent correlation between these two coating-performance parameters; that is, panels with minimal undercutting of the coating did not necessarily have less pitting.
Figure 14 shows the relationship between pitting corrosion depth on the panel face versus pitting corrosion depth adjacent to the scribe area. Again, the correlation is weak.
CONCLUSIONS
- Pit depths under repair coatings approach 30 mils adjacent to scribes and 20 mils under seemingly visually intact paint on the panel face. No pitting corrosion was observed on abrasive-blasted steel protected with high-solids coatings.
- This magnitude of attack in 40 months of exposure is significant. Thirty mils of corrosion in 40 months represents about half of the Navy criteria for potential structural repair for a 1/4-inch-thick steel bulkhead. Unchecked, this corrosion rate can lead to necessary structural repair.
- The depths of corrosion attack do not correlate with the visual inspections. Especially, they do not correlate with general rankings of rust-through in accordance with ASTM D6108. The depth of attack has some correlation to blistering; however, less depth of attack is observed with more extensive blistering.
- This work, and similar effort to quantify corrosion under coatings, represents an initial investigation of improved methods for ranking coatings to support long-term structural integrity. Measuring actual corrosion and material loss under the coating seems to be a better method for evaluating coating materials than the standard visual methods. At a minimum, destructive evaluation methods for corrosion and material loss should be used to augment visual rankings.
ABOUT THE AUTHORS

Patrick Cassidy has been working in the corrosion and coatings industry for over 10 years and is currently a senior engineer with Elzly Technology Corporation. He has been involved in a diverse number of programs including coatings research, field investigation and application of corrosion control products. He holds a Bachelor of Science degree in mechanical engineering from the University of Virginia. Cassidy is an SSPC-certified NAVSEA Coatings Inspector and has completed additional training in Navy Ship Corrosion Assessment and Cathodic Protection Design. In 2015, he was profiled in the JPCL annual bonus issue, “Coatings Professionals: The Next Generation.”

James A. Ellor has over 35 years of experience in the corrosion industry. He is currently a senior consultant with Elzly Technology Corporation. Throughout his career, Ellor has been involved in myriad programs including contract research, field investigations and application of corrosion control products. He holds a Bachelor of Science degree in chemical engineering from the University of California, Berkeley and is also a registered Professional Engineer, a NACE-certified Corrosion Specialist and Cathodic Protection Specialist.

John Wegand is a senior engineer at the U.S. Naval Research Laboratory within the Center of Corrosion Science and Engineering. Wegand has a Bachelor of Science degree in mechanical engineering from the University of Maryland and has over 30 years of experience working with the U.S. Navy executing and managing various research, development, test and evaluation technical programs. His experience ranges from development in the laboratory to implementation in the fleet, including policy and requirements development for the Naval Sea Systems Command.

James Martin has been with the NRL for over 18 years. He is the head of the Marine Coatings Technology and Systems section Code 6138. Martin is responsible for introducing coatings technology to the Fleet through applied research and development, testing and demonstrations. He has been active in addressing Fleet concerns from both maintenance and new construction with respect to coatings. Martin continues to introduce new technology that will help to reduce the life-cycle and ownership costs of today’s Fleet.

Paul Slebodnick is employed by the NRL in the Washington, D.C., Center for Corrosion Science & Engineering, under the Marine Engineering Section. He currently leads research programs in developing technologies for the United States Navy that produce maintenance reductions and reduce Ships Force workload. Slebodnick is responsible for demonstrating new technologies aboard Fleet combatants to determine readiness with in-service evaluation of the technologies prior to transitioning to the Fleet. He also leads Engineering for Research and Development of Tank Coatings under Naval Sea Systems Command, Technical Warrant Holder for Coatings and Corrosion Control — Ships, SEA-05P in Washington, D.C.

James Tagert is a materials research engineer at the Naval Research Laboratory and has over 12 years of experience working in the coatings industry. He graduated from the University of Maryland in 2004 earning a Bachelor of Science degree in mechanical engineering and is a member of both the American Society of Naval Engineers and NACE International. Tagert has worked at NRL since 2008 supporting U.S. Navy research and engineering programs related to materials science with an emphasis on the development and transition of advanced coating systems.
REFERENCES
- A. Webb et al., “Reducing Corrosion Control Costs with Rapid Curing Coatings,” www.nrl.navy.mil, U.S. Navy. [Cited: Dec 5, 2016.] www.nrl.navy.mil/content_images/07FA2.pdf.
- “Applying Single Coat Systems to Tank Internals on Ship,” Staff, JPCL, February 2009.
- P. Slebodnick, K. Santangelo, K. Thomas, J. Cuzzocrea, D. Zuskin, B. Brinckerhoff, “Eleven Years of Ultra High Solids Coating Usage in the U.S. Navy and Related Advances,” Washington D.C., U.S. Navy – Naval Research Laboratory, 2008. NRL/MR/6130-08-9153.
- SSPC-SP 5/NACE No. 1, White Metal Blast Cleaning, www.sspc.org/ST-000SP5.
- SSPC-SP 11, Bare Metal Power Tool Cleaning, www.sspc.org/SSPC-SP-11-Power-Tool-Cleaning-to-Bare-Metal.
- U.S. Navy, NAVSEA Standard Item 009-32. www.navsea.navy.mil, Cited Dec 5, 2016. www.navsea.navy.mil/Portals/103/Documents/SSRAC/NSI/FY14/009-32_FY14.pdf.
- ASTM D610, “Standard Practice for Evaluating Degree of Rusting on Painted Steel Surfaces,” www.astm.org/Standards/D610.htm
- ASTM D714, “Standard Test Method for Evaluating Degree of Blistering of Paints,” www.astm.org/search/fullsite-search.html?query=d714&.
- ASTM D1654, “Standard Test Method for Evaluation of Painted or Coated Specimens Subjected to Corrosive Environments,” www.astm.org/search/fullsite-search.html?query=d1654&.